


It seems like everyone is always on the go, and one of the most popular modes of transportation is ride-sharing.
And what better way to get from point A to point B than with Uber?
Whether you’re on your daily commute, traveling to a new city, or simply looking for a fun night out, Uber’s got you covered.
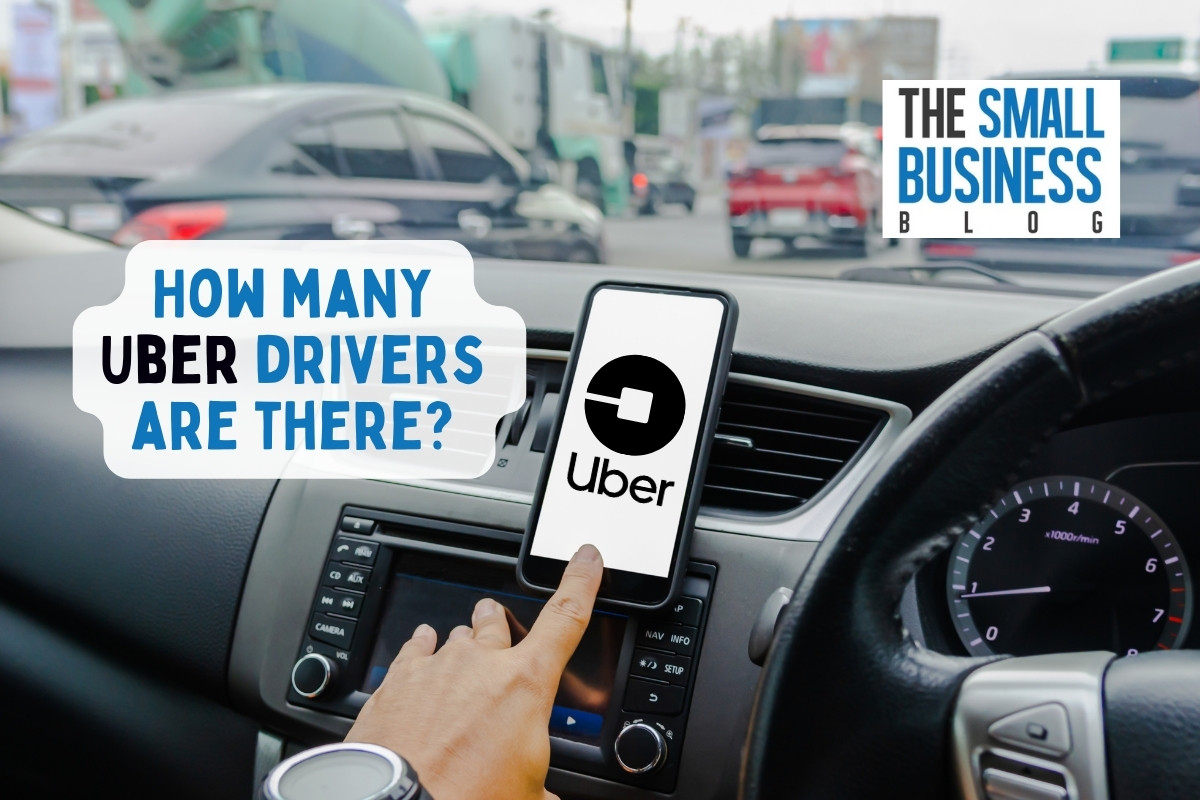
In this article, we’ll explore the demographics of Uber drivers: how many Uber drivers are there?
What are the benefits and downsides of the gig work?
From the most popular cities for Uber drivers to the top-performing vehicles, we’ll delve into the many facets of what makes a successful Uber driver.
So sit back, relax, and get ready for a ride on this fascinating journey into the world of Uber statistics!
Post Contents
- 1 Key Statistics
- 1.1 1. How many Uber drivers are there in 2024?
- 1.2 2. An estimated 22,800 people work for Uber worldwide
- 1.3 3. Over 20 million people earned over $100 billion using Uber from 2020 to 2022, excluding tips
- 1.4 4. In 2020, Uber handles gross mobility bookings worth $26.61 billion
- 1.5 5. Women make up 15% of the world’s Uber drivers and couriers
- 1.6 6. Each quarter, Uber makes billion trips around the world
- 1.7 7. 93 million people use the Uber platform each month
- 1.8 8. In the US, Uber’s rideshare division was expected to generate $29.59 billion in revenue in 2021
- 1.9 9. Nearly 13 million Uber trips completed in EVs in Q2 2022
- 2 Conclusion
Key Statistics
- Uber has 5.4 million drivers and 131 million monthly trips.
- 22, 800 people work for Uber worldwide.
- Over 20 million people earned over $100 billion using Uber from 2020 to 2022, excluding tips.
- In 2020, Uber handles gross mobility bookings worth $26.61 billion.
- Women make up 15% of the world’s Uber drivers and couriers.
1. How many Uber drivers are there in 2024?
Uber has 5.4 million drivers and makes 131 million trips each month.
Uber Technologies’ financial report for the fourth quarter of 2022 states that the business had 5.4 million drivers and couriers and made 131 million journeys per month the year before.
This is a significant increase from Uber’s 2 million drivers and 65 million riders in 2017, when the company first began.
In 2020, Uber updated its list of locales and said that its services are now provided in over 10,000 cities across 72 different countries.
As a result, it is among the biggest and most user-friendly ride-hailing businesses in the world.
(Uber Financial Report 2022)
2. An estimated 22,800 people work for Uber worldwide
Uber is a global company with employees all over the world.
According to Uber, 12,400 of its workers (54.37%) are located outside of the United States.
This means that Uber has a significant presence in other countries, and it is committed to hiring and retaining employees from all over the world.
Uber’s base compensation is about $150,000 per year.
Employees with H1-B visas typically earn a base salary of $153,750.
(Uber, Blind, H1B Salary Database)
3. Over 20 million people earned over $100 billion using Uber from 2020 to 2022, excluding tips
In the three years between January 1, 2020 and December 31, 2022, more than 20 million people used Uber to generate over $100 billion, excluding tips, according to Uber’s 2023 Environmental, Social, and Governance Report.
This includes more than 5 million drivers and couriers every month in just the fourth quarter of 2022.
(Uber 2023 ESG Report)
4. In 2020, Uber handles gross mobility bookings worth $26.61 billion
In 2020, bookings on all of Uber’s platforms came to $58 billion, which is nearly half of the total gross transaction value.
In comparison to the year before, when nearly $50 billion worth of bookings were made using the app, mobility bookings decreased by 46.46%.
The pandemic has significantly incapacitated the platform’s operations, resulting in a significant drop in gross mobility bookings.
- Q1 2017 – the platform’s gross mobility bookings totalled to $6.5 billion during the quarter
- Q2 2017 – the platform’s gross mobility bookings totalled to $7.48 billion during the quarter
- Q3 2017 – the platform’s gross mobility bookings totalled to $8.2 billion during the year
- Q4 2017 – the platform’s gross mobility bookings totalled to $9.19 billion during the quarter
- Q1 2018 – the platform’s gross mobility bookings totalled to $9.38 billion during the quarter
- Q2 2018 – the platform’s gross mobility bookings totalled to $10.17 billion during the quarter
- Q3 2018 – the platform’s gross mobility bookings totalled to $10.49 billion during the year
- Q4 2018 – the platform’s gross mobility bookings totalled to $11.48 billion during the quarter
- Q1 2019 – the platform’s gross mobility bookings totalled to $11.45 billion during the quarter
- Q2 2019 – the platform’s gross mobility bookings totalled to $12.19 billion during the quarter
- Q3 2019 – the platform’s gross mobility bookings totalled to $12.55 billion during the quarter
- Q4 2019 – the platform’s gross mobility bookings totalled to $13.51 billion during the quarter
- Q1 2020 – the platform’s gross mobility bookings totalled to $10.87 billion during the quarter
- Q2 2020 – the platform’s gross mobility bookings totalled to$3.05 billion during the year
- Q3 2020 – the platform’s gross mobility bookings totalled to $5.9 billion during the quarter
- Q4 2020 – the platform’s gross mobility bookings totalled to $6.79 billion during the quarter
(Uber)
5. Women make up 15% of the world’s Uber drivers and couriers
According to the ECG report of Uber, 15% of drivers and couriers worldwide are female based on the gender data obtained from driver’s licenses and other identification documents submitted by drivers and couriers.
Women make up 29% of people who drive and deliver, 17% of couriers, and 46% of drivers in the US alone.
Additionally, they were of every age, with 31% of them being between the ages of 18 and 29; 33% between the ages of 30 and 39; 21% between the ages of 40 and 49; and 15% beyond the age of 50.
(Uber 2023 ESG Report)
6. Each quarter, Uber makes billion trips around the world
The pandemic incapacitated Uber’s operations, resulting in a close to 25% drop in the total number of quarterly trips made on the platform.
At the end of 2017, Uber reached the 1 billion quarterly trips milestone.
This graph shows the number of Uber journeys per quarter since 2016 to 2020:
- Q1 2016 – the number of Uber trips completed during the quarter is 268 million
- Q2 2016 – the number of Uber trips completed during the quarter is 362 million
- Q3 2016 – the number of Uber trips completed during the quarter is 501 million
- Q4 2016 – the number of Uber trips completed during the quarter is 687 million
- Q1 2017 – the number of Uber trips completed during the quarter is 774 million
- Q2 2017 – the number of Uber trips completed during the quarter is 889 million
- Q3 2017 – the number of Uber trips completed during the quarter is 985 million
- Q4 2017 – the number of Uber trips completed during the quarter is 1.09 billion
- Q1 2018 – the number of Uber trips completed during the quarter is 1.14 billion
- Q2 2018 – the number of Uber trips completed during the quarter is 1.24 billion
- Q3 2018 – the number of Uber trips completed during the quarter is 1.35 billion
- Q4 2018 – the number of Uber trips completed during the quarter is 1.49 billion
- Q1 2019 – the number of Uber trips completed during the quarter is 1.55 billion
- Q2 2019 – the number of Uber trips completed during the quarter is 1.68 billion
- Q3 2019 – the number of Uber trips completed during the quarter is 1.77 billion
- Q4 2019 – the number of Uber trips completed during the quarter is 1.9 billion
- Q1 2020 – the number of Uber trips completed during the quarter is 1.66 billion
- Q2 2020 – the number of Uber trips completed during the quarter is 737 million
- Q3 2020 – the number of Uber trips completed during the quarter is 1.18 billion
- Q4 2020 – the number of Uber trips completed during the quarter is 1.44 billion
(Uber)
7. 93 million people use the Uber platform each month
In comparison to the same quarter in the previous year (Q4 2019), the number of monthly users has decreased by 9.7%.
However, over the last 4 years (Q4 2016–Q4 2020), the number of monthly active users on Uber has grown at a CAGR of 48.74%.
Since 2016, we have graphed the increase in monthly active platform users for Uber :
2016
- Q1 2016 – there were 19 million active platform users on Uber during the year
- Q2 2016 – there were 25 million active platform users on Uber during the year
- Q3 2016 – there were 33 million active platform users on Uber during the year
- Q4 2016 – there were 45 million active platform users on Uber during the year
2017
- Q1 2017 – there were 49 million active platform users on Uber during the year
- Q2 2017 – there were 57 million active platform users on Uber during the year
- Q3 2017 – there were 62 million active platform users on Uber during the year
- Q4 2017 – there were 68 million active platform users on Uber during the year
2018
- Q1 2018 – there were 70 million active platform users on Uber during the year
- Q2 2018 – there were 76 million active platform users on Uber during the year
- Q3 2018 – there were 82 million active platform users on Uber during the year
- Q4 2018 – there were 91 million active platform users on Uber during the year
2019
- Q1 2019 – there were 93 million active platform users on Uber during the year
- Q2 2019 – there were 99 million active platform users on Uber during the year
- Q3 2019 – there were 103 million active platform users on Uber during the year
- Q4 2019 – there were 111 million active platform users on Uber during the year
Uber During the Pandemic:
- Q1 2020 – there were 103 million active platform users on Uber during the year
- Q2 2020 – there were 55 million active platform users on Uber during the year
- Q3 2020 – there were 78 million active platform users on Uber during the year
- Q4 2020 – there were 93 million active platform users on Uber during the year
(Uber)
In comparison to 2020, when widespread lockdowns greatly impacted performance, that is an increase of 70.15 percent.
By 2023, $35.51 billion worth of rides will be ordered through Uber annually, according to eMarketer’s projection.
In comparison to the most recent full pre-pandemic year (2019), this would be an increase of 22.96%.
Take a look at Uber’s gross rideshare bookings in the most important market in its business portfolio from 2018 to 2022, provided in the following data by eMarketer:
- 2018 – the rideshare bookings from the United States totaled to $22.39 billion, accounting for 67.46% of the total
- 2019 – the rideshare bookings from the United States totaled to $28.88 billion, accounting for 66.19% of the total
- 2020 – the rideshare bookings from the United States totaled to $17.39 billion, accounting for 62.66% of the total
- 2021 – the rideshare bookings from the United States totaled to $29.59 billion, accounting for 67.07% of the total
- 2022 – the rideshare bookings from the United States totaled to $35.51 billion, accounting for 66.14% of the total
(eMarketer)
9. Nearly 13 million Uber trips completed in EVs in Q2 2022
Uber established targets to reach 100% of rides in no-emission vehicles, on micro mobility, or by public transportation by 2040 internationally.
According to the 2022 ESG report, 13.3 million trips already have been served by nearly 30,000 average monthly active no-emission vehicle drivers throughout the Uber platform in North America and some parts of Europe as of Q2, 2022.
(Uber 2022 ESG Report)
Conclusion
Uber is a global transportation network company that has revolutionized the way people get around.
With over 5.4 million drivers and couriers worldwide, Uber facilitates over 131 million monthly trips.
This makes Uber one of the largest transportation companies in the world.
The statistics on how many Uber drivers are there demonstrate the massive scale and reach of Uber’s business.
They show that Uber is a major player in the global transportation and logistics industry.
In addition to its economic impact, Uber is also having a social impact.
Uber has made transportation more accessible and affordable for everyone.
This is especially important in underserved communities, where people may not have access to traditional transportation services.