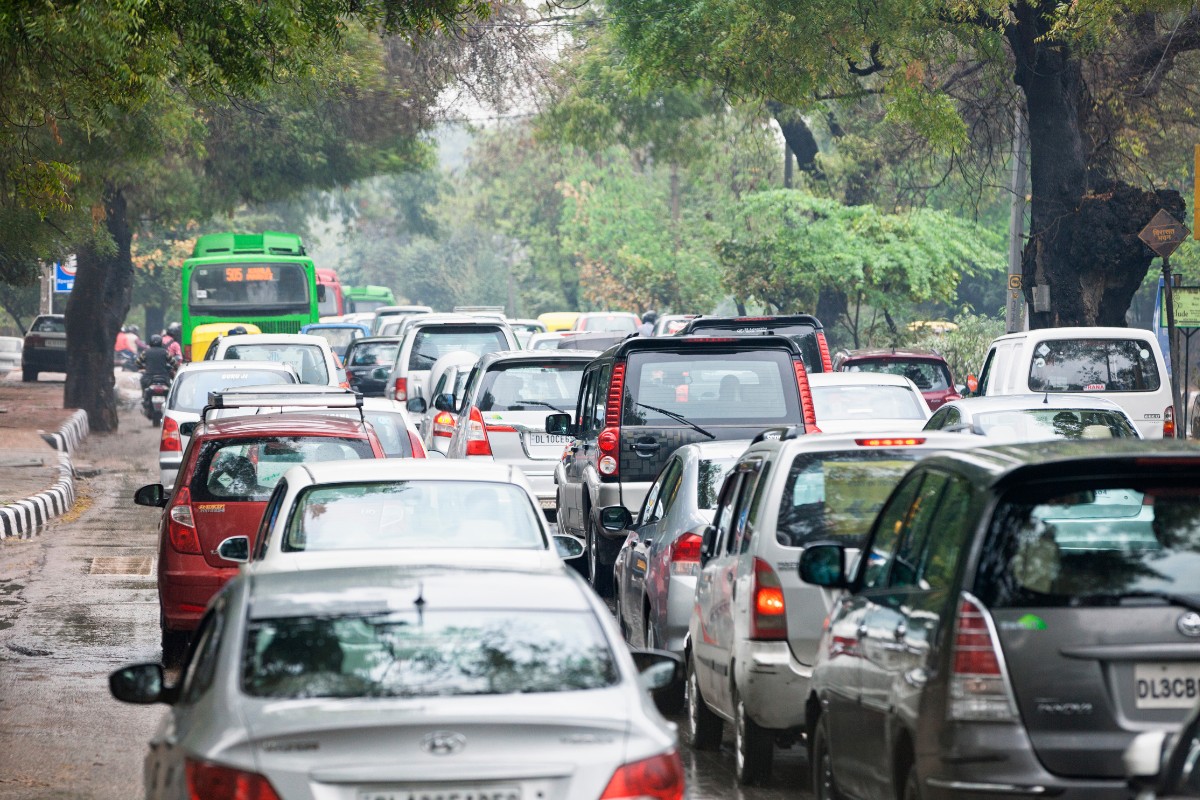
In 2024, commuting remains a universal challenge, transcending urban or rural living.
For purposes ranging from employment to education, we all grapple with the daily trek from point A to point B.
The fluidity of our commute, however, has evolved in response with our evolving surroundings.
This report dissects the average commute time statistics for 2024, unraveling the activity’s profound implications on our lives.
From productivity and stress levels to overall well-being, these numbers paint a picture of the modern commuter experience.
Post Contents
- 1 Key Statistics
- 2 Top Average Commute Time Statistics in 2024
- 2.1 1. Beijing had the longest average commute time in 2023 at 47 minutes
- 2.2 2. The average commuting time in most European countries is 38 minutes
- 2.3 3. The average commuting time in European Union is 25 minutes
- 2.4 4. London has the longest average commute time among 390 cities in 2022 worldwide.
- 2.5 5. The National Average Commute Time in the US is 27.6 minutes
- 2.6 6. 29% of U.S. workers reported that their daily commute is 15 to 29 minutes long
- 2.7 7. 33% of German respondents reported that their daily commute is 15 to 29 minutes
- 2.8 8. Australian city workers’ average commute has blown out to 66 minutes a day.
- 2.9 9. 29% of Philippine respondents reported that their daily commute is 15 to 29 minutes long
- 2.10 10. Urban respondents in China have longer commuting times than rural respondents
- 2.11 11. In 2019, 17 countries had a commuting time between 24 minutes and 28 minutes
- 2.12 12. Time needed for commute in Great Britain, by transportation 2020
- 2.13 13. In Bengaluru, the average commute time for car users is typically observed to be a minimum of one hour.
- 2.14 14. East Stroudsburg, PA Has the Longest Commute to Work in the U.S Among the Cities.
- 2.15 15. New York City has the longest average commute time in the U.S. at 34.7 minutes.
- 2.16 16. Public transportation in the U.S. takes up to 85% longer than commuting by car.
- 2.17 17. People in Dublin have the fifth longest average commuting time in the European Union, according to new research.
- 2.18 18. The average commute time for all workers has increased from 22 minutes in 1990 to 27 minutes in 2020
- 2.19 19. The world’s longest average commute on public and/or shared transportation is in Istanbul, Turkey (77 minutes)
- 2.20 20. China has the longest average commute time at 56 minutes
- 3 Conclusion
Key Statistics
- Beijing boasts the lengthiest average commute at 47 minutes
- Most European countries report an average commute time of 38 minutes
- New York City holds the title for the longest U.S. average commute, standing at 34.7 minutes
- Public transportation in the U.S. extends travel durations by up to 85% compared to car commutes, which clock in at a mere 25 minutes one way
- Workers with lengthier average commutes tend to favor public transportation
- Subways in the U.S. exhibit the lengthiest average commutes, mirroring Beijing’s 47-minute mark
Top Average Commute Time Statistics in 2024
1. Beijing had the longest average commute time in 2023 at 47 minutes

In 2023, Beijing dominated the average commute time statistics among China’s major cities, recording a substantial 47-minute one-way journey.
According to the latest statistics, an ideal commute is defined as under 45 minutes, while those enduring over 60 minutes of travel are classified as “extreme commuters.”
(The Beijinger)
2. The average commuting time in most European countries is 38 minutes
In Europe, the average commute clocks in at a brisk 38 minutes, a notable contrast to the United States, where it is a swifter 25 minutes.
Across the Atlantic, the United Kingdom stands out with a 45-minute average commute, grappling with some of Europe’s most congested roads.
Meanwhile, in bustling Asian cities, commuters face the longest daily journeys, largely a consequence of high congestion and population density.
A curious paradox shows that as public transit becomes a more significant mode of transport, commute times tend to lengthen.
On average, public transit commutes take 30 to 40% more time than their automobile counterparts.
(Transport Geography)
3. The average commuting time in European Union is 25 minutes
In 2019, EU workers logged an average commute of 25 minutes.
Latvian employees snagged the top spot with a 33-minute average, followed closely by Hungary and Luxembourg, both at 29 minutes.
Across the EU, 17 countries reported commute times ranging from 24 to 28 minutes.
On the flip side, Cyprus boasted the briefest commutes at 19 minutes, with Greece at 20 minutes, and Italy and Portugal tied at 21 minutes, marking the shortest journeys on the continent.
(Europa)
4. London has the longest average commute time among 390 cities in 2022 worldwide.
London tops the charts with the lengthiest average commute time per 10 kilometers, clocking in at 36 minutes and 20 seconds, as reported in the 2022 TomTom Traffic Index Ranking, covering 390 cities across 56 countries.
Here’s a quick look at the average travel times per 10 kilometers in five other global cities:
- London: 36 minutes and 2 seconds
- Bengaluru: 29 minutes and 10 seconds
- Dublin: 28 minutes and 30 seconds
- Sapporo: 27 minutes and 40 seconds
- Milan: 27 minutes and 30 seconds
These figures shed light on the diverse commuting experiences across the globe, where Londoners find themselves at the forefront of this travel time challenge.
(TomTom Travel Index)
5. The National Average Commute Time in the US is 27.6 minutes

As per the Census Bureau’s latest data, the average U.S. commute time clocks in at 27.6 minutes.
When tallying a round trip, that sums up to an approximate daily average of 53.2 minutes for the typical American commuter.
For those seeking brevity in their daily travels, Buffalo, NY, stands out with an average commute time of 20.3 minutes, closely followed by Columbus, OH, at 21.8 minutes.
These cities pave the way for the quickest journeys on the American commuting landscape.
(Zippia)
6. 29% of U.S. workers reported that their daily commute is 15 to 29 minutes long
In an online survey titled “Duration of Daily Commute,” involving 10,007 participants, insights into the American commuting landscape emerged.
These participants encompassed individuals commuting for work, school, or university.
29% of respondents clocked in with commute times spanning 15 to 29 minutes, marking the most frequently chosen response.
Meanwhile, 24% declared “I do not commute” as their status, followed by 21% of commuters who reported journeys under 15 minutes.
Those dedicating 30 minutes to an hour to their daily trek accounted for 19%, while 5% braved commutes lasting 1 to 2 hours.
Only a slender 2% bore the weight of commutes exceeding two hours.
(Statista)
7. 33% of German respondents reported that their daily commute is 15 to 29 minutes
In a recent 2023 online survey, 33% of respondents in Germany reported a daily commute spanning 15 to 29 minutes.
This striking statistic implies that slightly over one in three German workers enjoy the luxury of a relatively brief daily journey.
In contrast, the average American grapples with a 55-minute commute, making the German experience notably more efficient, with an average commute time of 35 minutes.
This is a revelation of the prevalence of shorter commutes in Germany, a trend likely caused by several key factors such as the country’s robust public transportation system, compact urban areas, and relatively high population density all converge to create a more streamlined and time-efficient daily commute for its workforce.
(Statista)
8. Australian city workers’ average commute has blown out to 66 minutes a day.
The Australian commute has seen a significant expansion over the years.
According to the freshly unveiled Household, Income, and Labour Dynamics in Australia (HILDA) Survey, the average weekly commuting time witnessed an uptick.
In 2002, workers logged a modest 3.7 hours per week, but fast forward to 2017, and that number ballooned to 4.5 hours.
Within Australian work commutes, mainland state capitals like Sydney, Melbourne, Brisbane, Adelaide, and Perth took the lead in the endurance test.
For these urban settlers, the daily to-and-fro averaged a substantial 66 minutes which is a hefty 20% surge from the approximately 55-minute mark recorded in 2002.
(The Conversation)
9. 29% of Philippine respondents reported that their daily commute is 15 to 29 minutes long

In a June 2022 survey on mobility in the Philippines, findings shed light on the daily commuting habits of the populace.
Notably, 29% of respondents reported devoting 15 to 29 minutes each day to their commutes, encompassing trips to work, school, or university.
A sizable 26% of those surveyed took it a notch further, allocating 30 to 59 minutes on their daily commutes.
(Statista)
10. Urban respondents in China have longer commuting times than rural respondents
In China’s commuting landscape, a clear distinction emerges between urban and rural respondents.
The data reveals that urban dwellers invest an average of 0.56 hours daily on their commutes, whereas their rural counterparts spend a comparatively shorter 0.41 hours traversing to their destinations.
This equates to urban respondents dedicating an additional 15 minutes each day to their daily travels.
Furthermore, when examining the data across cities with varying degrees of urbanization, an intriguing pattern takes shape.
Residents in cities boasting high urbanization rates, exceeding 70%, contend with longer daily commutes compared to their counterparts in cities with lower urbanization rates, falling below 70%.
(Springer)
11. In 2019, 17 countries had a commuting time between 24 minutes and 28 minutes
According to Eurostat’s findings, a significant cluster of countries falls within the commuting sweet spot, clocking in at an average duration of 24 to 28 minutes.
Take a look at this data for more details:
- Belgium — the average commute time in the country is at 28 minutes
- Ireland— the average commute time in the country is at 28 minutes
- Czechia — the average commute time in the country is at 27 minutes
- Netherlands — the average commute time in the country is at 27 minutes
- Romania — the average commute time in the country is at 27 minutes
- Norway — the average commute time in the country is at 27 minutes
- Malta — the average commute time in the country is at 26 minutes
- Sweden — the average commute time in the country is at 26 minutes
- Switzerland — the average commute time in the country is at 26 minutes
- Bulgaria — the average commute time in the country is at 26 minutes
- Denmark — the average commute time in the country is at 26 minutes
- Germany – the average commute time in the country is at 26 minutes
- France — the average commute time in the country is at 26 minutes
- Spain — the average commute time in the country is at 25 minutes
- Croatia — the average commute time in the country is at 24 minutes
- Austria — the average commute time in the country is at 24 minutes
- Poland — the average commute time in the country is at 24 minutes
(Statista)
12. Time needed for commute in Great Britain, by transportation 2020
In Great Britain’s work commutes during October to December 2020, transportation mode was the key determinant of journey duration.
National rail trains emerged as the frontrunner, demanding the most substantial time commitment with journeys exceeding an hour.
On the flip side, walking exhibited the swiftest average commute at a mere 16 minutes, presenting the allure of simplicity and efficiency.
However, when it comes to the daily grind, it’s the trusty car that reigns supreme.
An overwhelming 68% of commuters in Great Britain chose the automobile as their mode of choice, making it the undisputed champion of work commute transportation.
Meanwhile, one in ten commuters opted for the convenience of train travel, highlighting the enduring appeal of rail journeys.
(Zippia)
13. In Bengaluru, the average commute time for car users is typically observed to be a minimum of one hour.

In Bengaluru, the daily commute calculus spells out a distinct story, as outlined in a report under the banner of the Personal2Public campaign, jointly led by NGOs such as the Bangalore Political Action Committee (B.PAC) and WRI India.
For car commuters in the city, a journey spanning the customary 10 kilometers ushers in a minimum of one hour’s commitment.
The return trip is no less demanding, with car users dedicating approximately 1 to 1.5 hours for the round trip.
Meanwhile, two-wheeler enthusiasts cover the same distance in a relatively nimble 35 to 40 minutes, showcasing the agility of this mode of transportation.
Metro riders, on the other hand, enjoy a more streamlined experience, with their primary mode of transport requiring less than 45 minutes on average.
(The Hindu)
14. East Stroudsburg, PA Has the Longest Commute to Work in the U.S Among the Cities.
East Stroudsburg, PA, with its modest population of approximately 76,460, grapples with an average commute time of 38.6 minutes.
Tucked away in northern Pennsylvania, this community finds itself situated roughly an hour and a half from the bustling streets of New York City and a two-hour drive from Philadelphia.
However, when it comes to commutes, it is the greater New York City area (New York-Newark-Jersey City) that stands as the undisputed champion of challenging journeys among the top 100 most populous metro areas in the U.S.
(TitleMax)
15. New York City has the longest average commute time in the U.S. at 34.7 minutes.
In U.S. cities, New York claims the throne for the lengthiest average commute, tallying an impressive 34.7 minutes.
On the other hand the title of the shortest average commute time goes to Great Falls, MT, with a mere 15.3 minutes spent en route.
Joining New York in the ranks of longer commutes are:
- Long Island: 33.3 minutes
- Washington, DC: 32.8 minutes
- Newark: 31.1 minutes
Conversely, cities embracing brevity in daily travels include:
- Buffalo: 20.3 minutes
- Des Moines: 20.3 minutes
- Omaha: 20.2 minutes
- Wichita: 19.5 minutes
And the reigning champion of swift commutes remains Great Falls, Montana, where residents complete their journeys in just 15.3 minutes.
(Way Blog)
16. Public transportation in the U.S. takes up to 85% longer than commuting by car.
In the United States, the daily car commute is a brisk affair, clocking in at just 25 minutes on average.
However, the story takes a different turn when it comes to various modes of public transportation.
For instance, bus travel stretches the journey to an average of 45 minutes, while subway riders log an average of 47 minutes in transit.
Census data paints a clear picture: bus commuters dedicate 45 minutes to their daily trek, whereas subway riders commit 47 minutes to their work-bound voyage.
The situation grows even more time-intensive for those relying on commuter rail services, with a considerable 71.9-minute investment for their daily round trip.
(Zippia)
17. People in Dublin have the fifth longest average commuting time in the European Union, according to new research.
In Dublin, Ireland, the daily commute demands nearly an hour.
This data shows a stark contrast to the rest of the country, where journeys typically clock in at under 45 minutes.
As for the top contenders in the league of longer commutes, Budapest, Paris, Amsterdam, and London (note that this research predates Britain’s exit from the EU) emerge as the frontrunners.
Commuters in Budapest and Paris shoulder the heaviest burden, spending close to 70 minutes on their daily travels.
(National Equity Atlas)
18. The average commute time for all workers has increased from 22 minutes in 1990 to 27 minutes in 2020
In both the past and present, Asian American and Black workers shoulder the weight of the lengthiest commutes.
Back in 1990, Asian American workers logged an average commute of 26 minutes, while Black workers trailed closely behind at 25 minutes.
Fast forward to 2020, and the numbers have ticked upward.
Asian American workers now spend an average of 30 minutes on their daily journeys, while Black workers have seen their commutes extend to an average of 29 minutes.
(National Equity Atlas)
19. The world’s longest average commute on public and/or shared transportation is in Istanbul, Turkey (77 minutes)

Istanbul, Turkey, has secured the title of world’s lengthiest average commute, as per recent statistics from transportation analytics firm Moovit.
Commuters in this bustling metropolis invest a staggering 77 minutes each way in their daily journeys.
Mexico City nabs the runner-up spot, with an average commute time of 73 minutes for each leg of the trip.
Joining the ranks of cities where daily commutes pack a punch are New York, Bangkok, and Rio de Janeiro.
In these urban hubs, over 11% of the population embarks on marathon commutes exceeding 2 hours one way.
(Share with Oscar)
20. China has the longest average commute time at 56 minutes
China, home to the world’s largest population, grapples with staggering average commute times at 56 minutes.
The numbers underscore that Chinese commuters endure an average journey that’s twice as long as their American counterparts.
Few countries can boast shorter average commute times, with Italy clocking in at just 23 minutes.
(Zippia)
Conclusion
Commuting is a universal reality for people worldwide, with daily journeys to work or school being the norm.
In the United States, the average one-way commute clocks in at 27.6 minutes, reflecting the nation’s diverse commuting landscape.
However, the commuting experience varies widely, particularly in states and cities with high population density.
These factors play a key role in determining just how much time you’ll spend navigating traffic or public transportation.
Your daily journey matters, impacting both your productivity and overall well-being.
We appreciate your engagement with our coverage of the average commute time statistics for 2024.
Stay tuned for more insights on the ever-evolving dynamics of work and life.


