


Nowadays, we’re all well accustomed to applications being a part of everyday life, and plenty of app revenue statistics support that notion.
Whether for entertainment, life management, business, or any other use case, there’s pretty much an app for just about anything these days.
In 2022, mobile games made up 63% of consumer app spending, with Google Play contributing 38% to the total amount.
This roughly equates to $37.3 billion for the year.
There’s a lot of money to be made in this market, and it continues to grow to impressive heights.
The mobile app market is vast, and there are many different ways that developers are able to make money.
With various revenue models, applications, and demographics, the earning potential in this industry is substantial.
Post Contents
Key Statistics
- Total ad revenue for applications in 2022 was $567.49 billion
- The most used monetization strategy in apps is in-app purchases
- The market for in-app purchases expanded from $141.75 billion to $176.63 billion from 2022 to 2023
- Spending on the App Store is on track to reach $200 billion by 2025
- 98% of Google Play’s revenue comes from free applications
- iOS accounted for 67% of consumer app spending in 2022
- In-app subscriptions rose to $17.1 billion in 2022
- Mobile ad spending increased by 13.8% from 2021 to 2022
- The most mobile app revenue is generated in China
- Revenue from paid applications is expected to reach $5.25 billion in 2022
App Revenue Statistics: Starting With the Basics
With over a decade of rapid growth, the mobile app market has cemented itself into our everyday lives.
Once seen as merely a new form of entertainment, now, many applications offer unique services that make our lives a little bit easier.
Considering the size of the app market, you can expect it generates quite a bit of revenue.
This revenue comes from many different sources, which has led to a long list of interesting statistics on the topic.
Keep reading below for a general overview of some of the most prominent app revenue statistics.
1. Lots of Apps Means Lots of Money
Although there have been some big earning applications throughout the years, the market’s revenue comes from many different angles.
Considering the sheer number of available applications makes the staggering revenue figure a bit more digestible.
Recent statistics show that there are roughly 5.195 million apps on the market.
Keep in mind that this considers applications across all operating app stores.
The total number can be broken down into 3.553 million for Google Play and 1.642 million on the Apple app store.
It doesn’t matter how many of these applications are free, as a majority of the market’s revenue stems from in-app purchases.
Also referred to as microtransactions, these can be found in essentially any game app.
Applications that focus on a different niche can benefit from ad revenue and many other monetization strategies.
(TechJury)
2. The Google Play Store Raked in Billions for 2022
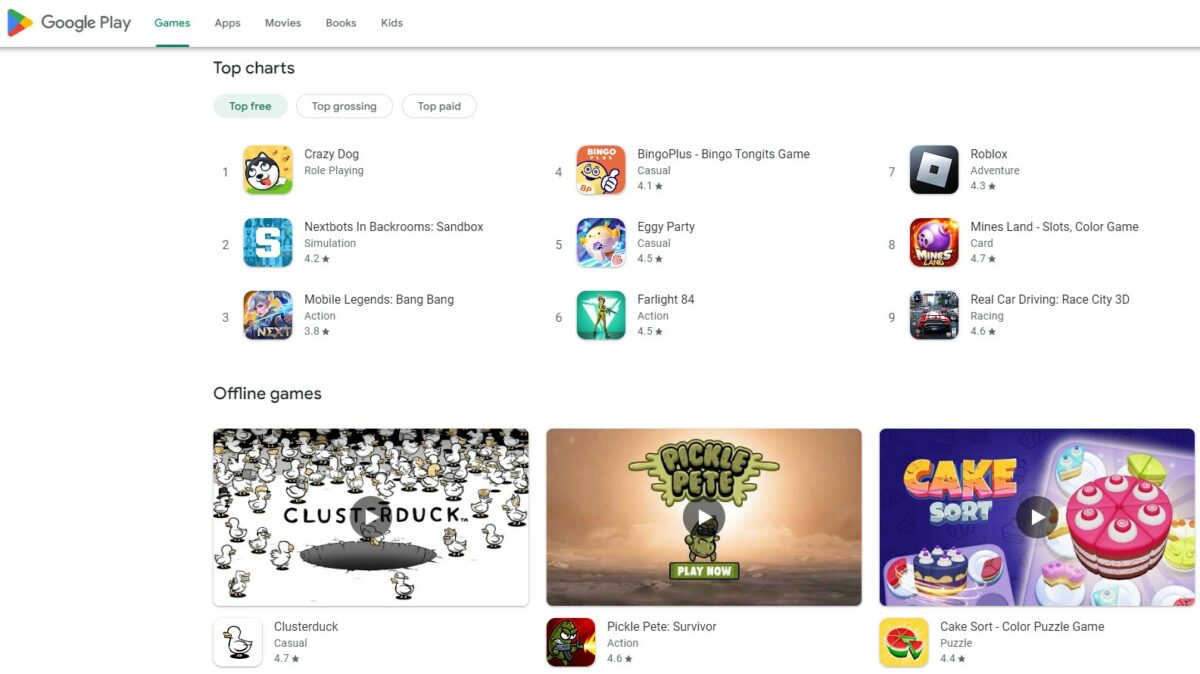
Many might be surprised at the figure above highlighting how many more applications are on the Google Play Store compared to Apple.
With millions of more applications, it isn’t hard to discern that the Play store is pulling some decent cash.
Statistics tell us that the Google Play Store generated $42.3 billion from games and other applications in 2022.
Needless to say, this is a healthy year for Google Play, and it continues to prove to be profitable throughout 2023.
Although $40+ billion is a healthy number, this is actually down 11.6% from 2021.
This is likely due to a spike in user interest from Covid that dwindled over the last few years.
(TechJury)
3. Mobile Ad Spend Over the Years
As more and more organizations catch onto the benefit of running ads on mobile devices, this has led to a thriving revenue stream for mobile applications.
Even if most of us skip past every ad on mobile apps, you might be surprised at just how many people interact with those ads.
They must be effective with certain demographics, as mobile ad spend continues to increase with each passing year.
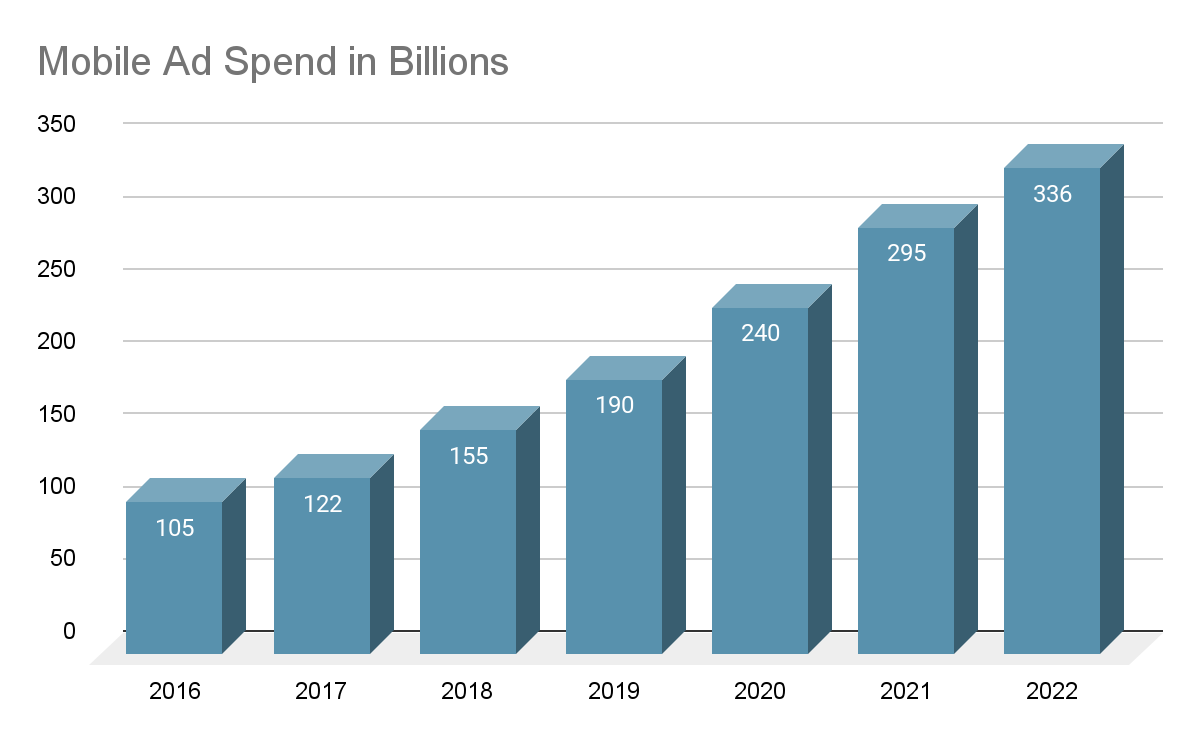
Companies wouldn’t be spending this kind of money if it wasn’t an effective marketing strategy.
Of course, not every mobile ad will pay off, but it’s a relatively new strategy that’s hard to ignore, considering the supporting numbers.
You can also take this same timeframe and review the app and game revenue.
Statistics show some interesting trends as revenue was on a consistent increase up until around Q4 of 2021.
(BusinessOfApps)
4. App and Game Revenue (Quarterly)
If you break down revenue quarterly, the app market seemed to be on a healthy trend line for quite a few years.
However, the pandemic disrupted this trend, which is no surprise.
The table below shows how revenue for games and other applications shifted from 2016 up until now.
Keep in mind that the numbers shown are in the billions.
| Year/Quarter | Q1 | Q2 | Q3 | Q4 |
| 2016 | 9.1 | 10.8 | 11.6 | 12 |
| 2017 | 13.5 | 13.6 | 15.3 | 15.7 |
| 2018 | 16.7 | 17.7 | 17.8 | 19.1 |
| 2019 | 20.7 | 22.6 | 23.3 | 22.4 |
| 2020 | 23.3 | 26.9 | 28.9 | 31.9 |
| 2021 | 31.8 | 33.1 | 33.6 | 34.5 |
| 2022 | 32.5 | 32.5 | 31.6 | 32.5 |
| 2023 | 33. | 33.6 | N/A | N/A |
As you can see, once the data reaches 2021 to 2023, the figures start to jump around a little rather than a fairly consistent incline.
There were many disruptions in life with the prevalence of Covid, and technology went through many rapid changes.
Even with a small bump in the road, the mobile app market isn’t hurting by any means.
It’s more profitable than it has ever been.
In-app purchases may be a focal point for revenue strategies when it comes to apps, but downloads carry their own weight in this conversation.
(BusinessOfApps)
5. Hundreds of Billions of Downloads
Considering the number of smartphones in the world, it isn’t too difficult to imagine how hundreds of billions of app downloads could even happen.
The most recent data tells us that the app market projected roughly 235.30 billion app downloads for 2022.
Even if this projection was off, it’s still a massive number.
Although there are plenty of free apps available on the market, paid app revenue brought in $5.25 billion for 2022.
People are definitely purchasing apps and spending more money on in-app purchases.
You can imagine how many applications the average smartphone user has downloaded.
This figure will continue to rise as more people adopt smartphone technology and the mobile app market expands.
(Statista)
Taking a Deep Dive
If you thought the data points mentioned above were impressive, wait until we dig a little deeper into the statistics on this topic.
The rabbit hole of the mobile app market goes very deep, and it entails more ways to make money than you might think.
The statistics above provide a pretty general overview of the state of the app market.
When you look beyond the surface level, you’ll find many interesting facts about different subsections within the market.
For example, the Android and iOS market for applications comes with many unique statistics that reflect their success, demographics, revenue, and more.
6. How Many iOS Apps Were Downloaded in 2022?
There’s no argument that the Apple app store is iconic in its own right.
Pioneering how we see mobile games and applications, it’s a staple when it comes to anything related to apps.
In 2022, 142.6 billion apps were downloaded from the Apple app store.
Of course, this is pretty minor compared to the numbers that the Google Play store is pulling, but it’s still steep nonetheless.
Although Google Play hosts a large number of applications, a majority of iOS apps are regarded for their high quality.
Even with Apple’s numbers falling behind Android, it’s still considered a leader in the mobile app market.
Apple is a force that’s pretty much synonymous with mobile apps, and there will be billions more downloads in the coming years.
(TechJury)
7. Free Apps Generate Most of Google Play’s Revenue
At first, it may not make much sense, but once you factor in the in-app purchases, it all comes full circle.
It’s understandable to wonder how free apps could generate the most revenue, but a majority of it comes from in-app purchases.
To be more specific, free apps account for 98% of the Google Play Store’s revenue.
Between in-app purchases and consistent advertising, free applications have more than one way to make money.
Offering a free download for an application is an easy way to bring in a bunch of new users.
A lot of them may not stick around for the long run, but they might click on an ad or check out the available in-app purchases before they go.
In many cases, these small actions are enough to generate revenue.
Now, take that same thought and apply it to millions of people, and you end up with billions in revenue.
(TechJury)
8. Revenue Broken Down by Major Regions
You can expect a large chunk of the app market’s revenue to come from a long line of developed nations throughout the world.
Statistics make it pretty clear that the U.S., China, and Japan are leaders in this regard.
Of course, there are many other regions of the world that contribute to the sizable revenue of the global app market.
The list below provides data on the annual app revenue for some of the most active regions for 2022.
- China = $58 billion
- United States = $42.1 billion
- Japan = $17.7 billion
- Europe = $17.7 billion
- Rest of the World = $31 billion
China is a whole other monster when it comes to the mobile app market.
Due to their population and influence on technology trends such as mobile applications, the Chinese are far ahead of any other nation on this topic.
For another angle on the market’s growth, you can take a look at projections for the next few years.
In short, the market is expected to reach nearly half a trillion dollars by 2027.
(BusinessOfApps)
9. Let’s Review the CAGR Projections
Many industry experts have weighed in on how the CAGR for the mobile market will change over the coming years.
Although they’re merely projections at this time, they definitely look healthy for the market.
By 2027, the app market is expected to grow at a CAGR of 24.2%, potentially leading to a market size of $419.87 billion.
There’s no questioning the size of this number, but it also isn’t surprising considering the current trajectory of the app market.
140 billion apps were downloaded in 2021, and there will be hundreds of billions more, if not trillions, by the time 2027 rolls around.
In regard to market revenue, in-app purchases will be on track to run the show, as there are an endless number of options here.
(TheBusinessResearchCompany)
10. What are the Main Types of In-App Purchases?
Those who don’t commonly participate in in-app purchases might be a little confused as to what they look like.
In-app purchases can be offered in many forms but are generally associated with the gaming niche.
Over the years, it has become apparent that in-app purchases is one of the most profitable routes for any application.
Below are some of the most common types of in-app purchases that you’re likely to come across.
- Single-use digital products
- Non-consumables
- Subscription-based
Depending on your preferences, some of these may seem more common than others.
A majority of individuals manage some type of subscription through an application on their phone.
Due to these features, the same application is bound to promote services and offerings regarding their subscription as well.
This never-ending cycle leads to more sales for the company, as people can easily spend money with just a few taps.
Developers have made it easier than ever to spend money on an application, not to mention the onslaught of incentives to do so.
Whether you’re part of this crowd or not, there are a lot of people who willingly put money into apps on a consistent basis.
(TheBusinessResearchCompany)
Revenue Statistics on Different Categories
So far, all of the statistics mentioned in this article take a look at the topic from an all-encompassing standpoint.
However, there’s plenty of data available on the specific types and categories of apps that are leading the growth of the overall market.
Most adults in the United States are on their smartphones for at least five hours every day.
You can assume the variety of applications that are sprinkled throughout this time.
In the same vein, some applications are used much more than others and contribute heavily to the market’s revenue.
There are many different standpoints you can look at that’ll provide some interesting information regarding leading apps in the market.
11. Top App Categories Worldwide

Among the various categories of applications on the market, social, video games, and entertainment take the cake.
They’re the driving factors behind the market’s revenue and contribute heavily to its ongoing success.
We also found it interesting that other categories currently boast the highest quarterly growth rate.
These categories and their respective growth rates include:
- Health and Fitness = 20%
- House and Home = 21%
- Video Players and Editors = 21%
Between leisure and our professional lives, each of those categories serves a purpose that can be utilized on a daily basis.
This is inherently a part of their success and is important in the industry’s growth.
(TechJury)
12. Top App for Non-Game Revenue
When people discuss revenue in the mobile app market, most immediately sway toward video games and entertainment.
It makes sense, considering their influence on users.
Then again, these categories are just a sliver of what’s available.
Regarding the non-game app that brings in the most revenue, it actually falls on a popular social media application.
You might have already guessed it, but TikTok is leading the way when it comes to non-game app revenue.
Recent stats show that the application makes $110 million every month, and this is entirely from user spending.
20% to 30% of all in-app purchases on TikTok come from the United States, and TikTok is only getting bigger as we speak.
This application would fall into the video players and editors category.
Even if you don’t use the app, there’s a good chance you’ve heard it in conversation more than once.
(TechJury)
13. New Applications are Hitting the Market by the Thousands
Part of what’s adding to the growth of the mobile app market is the sheer number of apps.
In just February 2023 alone, there were 87,000 new applications that appeared on the Google Play Store.
Once again, even if every one of them is free, many will still generate revenue from in-app purchases.
It’s a storm that can’t be stopped as the app market continues to expand at a rapid pace.
The monetization options within applications are broadening as well.
Around 50% of in-app purchases stem from non-game applications.
In-app purchases also account for roughly 79% of gaming apps’ revenue.
From large corporations to indie developers, there’s enough space for everyone.
Although this is true, the market is equally saturated, making it challenging for newcomers to break through the noise.
(TechJury)
14. Average Revenue Per Download
We’ve been throwing around a lot of big numbers throughout this article, but what does the revenue look like for each individual download?
In reality, this is some relatively simple math, and it comes out to $2.02 for every download.
It may not sound like much for one person, but this quickly reaches into the billions with the number of people who use applications on a daily basis.
Keep in mind that a figure like this will constantly change, but it’s a general figure you can work with for reference.
You also want to take into consideration the actual cost of in-app purchases.
With varying price points, some users stick to making cheap purchases, while others go all out and spend a surprising amount of money.
Regardless of those nuances, once you multiply the average revenue per download by the user count, you quickly soar into the billions.
(Statista)
15. Global Consumer Spending on Mobile Apps and Games

Taking a look at available data from 2021, global consumer spending on mobile apps increased by 19.7% overall from the previous year.
With $85.1 billion going to the App Store and $47.9 billion to Google Play, both saw a substantial jump from 2020 in this category.
Here are a few other standout statistics regarding this topic:
- In Q3 of 2021, Google Play saw consumer spending rise by 18.6%
- The Google Play Store generated roughly $23.4 billion in the first half of 2021
- Looking at the App Store alone, it saw a 17.7% increase in global consumer spending between 2020 and 2021
For younger generations, in-app purchases are commonplace and are much more likely to give up their money for such things.
Older generations are a bit more weary regarding in-app purchases, as some people have a hard time finding the value in them.
With applications making it easier than ever to make a purchase, it also makes you wonder how many purchases are made on accident.
Without multi-step security features, sometimes all you need is your thumbprint to authorize a purchase in an application.
Among the many unique details on how the app market operates, billions of dollars are on the table each year.
Developers and organizations alike are aware of this, which is why tens of thousands of new apps hit the market every year.
(MobileMarketingReads)
Final Thoughts
Depending on how you use applications in your personal life, some of the information in this article may come as a shock.
While some people barely use them, others are entirely obsessed.
In-app purchases are inescapable in this day and age.
Considering how much money they make, it’s no wonder they’re found in essentially every new application.
This article covered some of the most relevant app revenue statistics to help you get a behind-the-scenes look at the mobile app market.