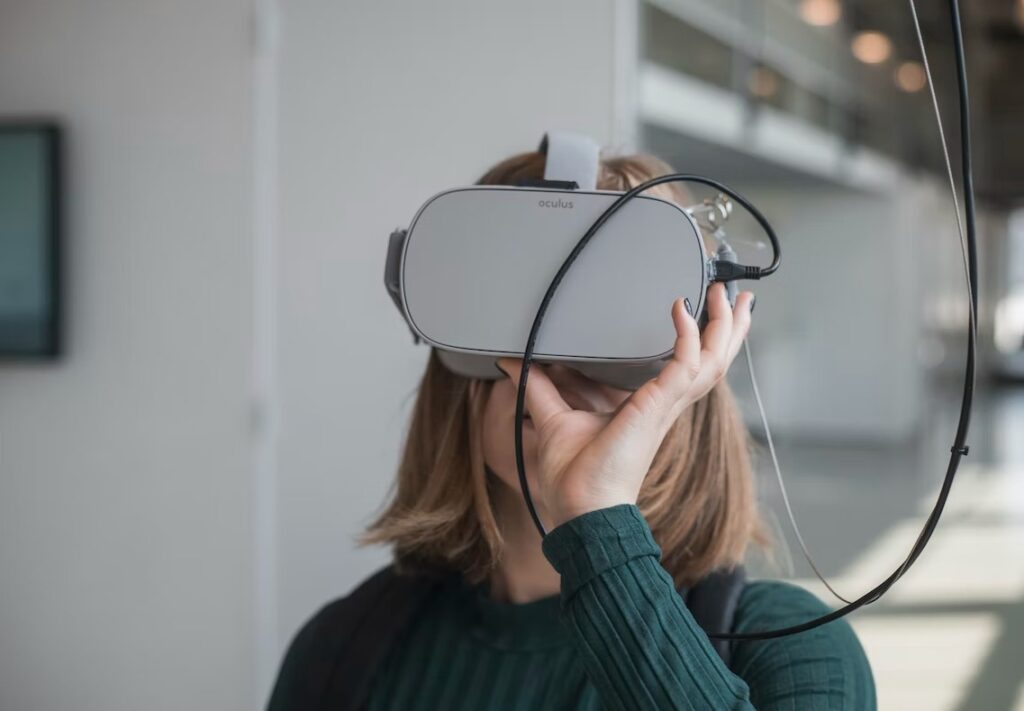
Have you ever seen people wearing those big over-eye glasses and thought they are weird?
Well, it might not be long before everyone in your neighborhood, including you, will be using this device regularly.
Welcome to modern times!
A world of virtual reality headsets where video games seem more real than reality itself.
What do the VR headset sales and market share look like? Let’s find out!
Post Contents
VR Headset Sales and Market Share
It’s time we brush our knowledge on VR headset sales and market share.
Why?
Maybe you haven’t realized, this is one of the fastest-growing sectors in the technology industry today.
Here is a look at VR headset sales from 2017 to 2022:
- 2017 – 3.8 million pieces of VR headsets have been sold during the year
- 2018 – 4.42 million pieces of VR headsets have been sold during the year
- 2019 – 5.51 million pieces of VR headsets have been sold during the year
- 2020 – 7.86 million pieces of VR headsets have been sold during the year
- 2021 – VR sales doubled in 2021. 14.25 million pieces of VR headsets have been sold during the year
- 2022 – 19.14 million pieces of VR headsets have been sold during the year
Projections on VR Headset Sales

Moving forward, sales of VR headset is projected to maintain an upward trajectory. Here is data on the VR headset sales forecast from 2023 to 2027:
- 2023 – 21.76 million pieces of VR headsets are expected to be sold on this year
- 2024 – 23.62 million pieces of VR headsets are expected to be sold on this year
- 2025 – 24.91 million pieces of VR headsets are expected to be sold on this year
- 2026 – 26.52million pieces of VR headsets are expected to be sold on this year
- 2027 – 26.68 million pieces of VR headsets are expected to be sold on this year
As can be observed from the data above, VR headset sales will continue growing, although at a much slower pace compared to the 2020 to 2022 period.
Economic uncertainty and rising device prices are forecasted to take a heavy toll on demand, leading to a more conservative growth rate in the coming years.
Sinking VR Headset Sales
While VR headset sales started off the new decade with impressive statistics, there has been a significant downgrade this year.
VR headset sales in the world’s biggest market, the United States, fell 2% YoY in December, raising concerns about the future of the largest player in the industry, Meta.
VR headset sales slumped to $1.1 billion in December, representing a 2% decline from the same period a year ago.
Moreover, global shipments of VR headset devices fell to 9.6 million as of the latest count – a 12% downgrade from December 2021.
To make matters worse for Meta, Apple Inc is reportedly planning to enter the market as early as next year.
Aside from the tougher competition, tech giants will navigate through the shortage of semiconductors and the stricter US-China tech war.
VR Headset Market Share in 2021
Meta’s Quest 2 is the king of the VR headset streets in 2021.
Take a look at these models and their respective share from the total last year:
- Meta Quest 2 – the device captured 39.62% of the entire VR headset market during the year
- Valve Index – the device captured 15.79% of the entire VR headset market during the year
- Oculus Rift S – the device captured 14.77% of the entire VR headset market during the year
- HTC Vive – the device captured 8.26% of the entire VR headset market during the year
- Windows Mixed Reality – the device captured 5.69% of the entire VR headset market during the year
- Oculus Rift – the device captured 4.84% of the entire VR headset market during the year
- Meta Quest – the device captured 4.35% of the entire VR headset market during the year
- HTC Vive Pro – the device captured 1.94% of the entire VR headset market during the year
- HTC Vive Cosmo – the device captured 1.82% of the entire VR headset market during the year
- SteamVR – the device captured 1.93% of the entire VR headset market during the year
VR Headset Market Share in 2022
Here is what the VR headset market share looks like this year:
- Meta Quest 2 – the device captured 46.02% of the entire VR headset market during the year
- Valve Index – the device captured 14.36% of the entire VR headset market during the year
- Oculus Rift S – the device captured 13.10% of the entire VR headset market during the year
- HTC Vive – the device captured 7.31% of the entire VR headset market during the year
- Windows Mixed Reality – the device captured 4.99% of the entire VR headset market during the year
- Oculus Rift – the device captured 4.18% of the entire VR headset market during the year
- Meta Quest – the device captured 3.95% of the entire VR headset market during the year
- SteamVR – the device captured 2.14% of the entire VR headset market during the year
- HTC Vive Pro – the device captured 1.72% of the entire VR headset market during the year
- HTC Vive Cosmo – the device captured 1.60% of the entire VR headset market during the year
VR devises Usage Statistics
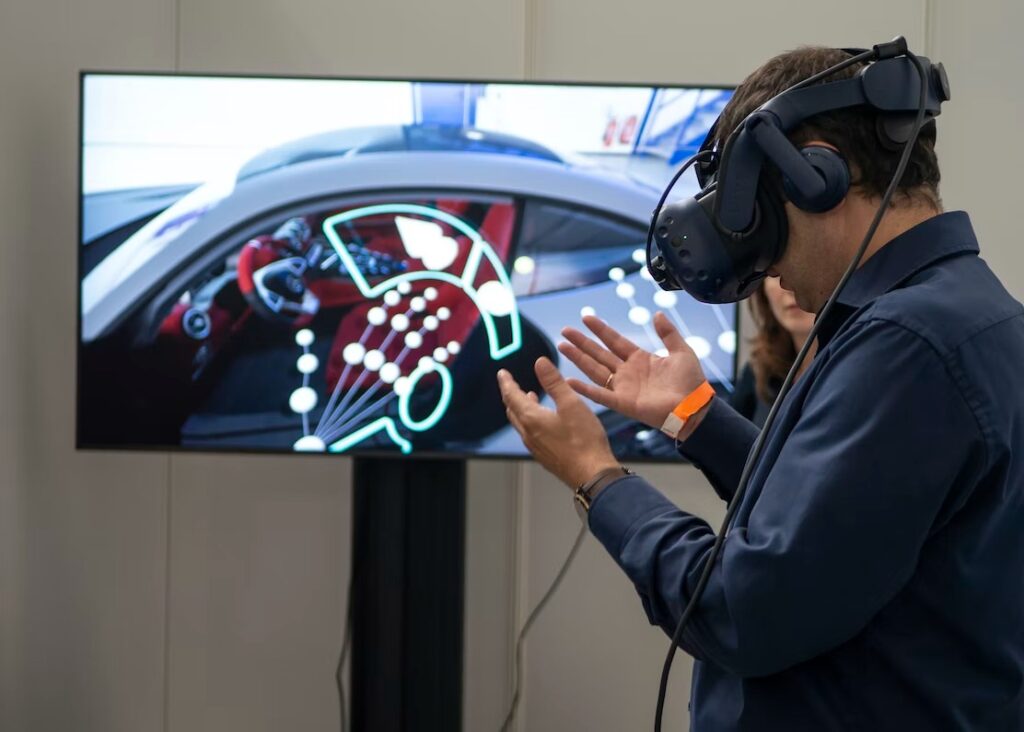
VR headsets can be for fun and games, but they also serve many other purposes.
This information shows VR devices are most helpful in the healthcare, education, and manufacturing industries.
- Gaming – 61% of VR devices are used for gaming purposes
- Healthcare and medical services – 41% of VR devices are used for health-related interventions
- Education – 41% of VR devices are used for educational purposes
- Manufacturing – 23% of VR devices are used for manufacturing and automotive prototype demonstrations
- Entertainment – 21% of VR devices are used for showcasing television and movie shows
- Workforce – 20% of VR devices are used for workforce development
- Marketing – 16% of VR devices are used for advertising products and services
Conclusion
This data on VR headset sales and market share shows that virtual reality is a growing niche in the technology industry.
Nowadays, VR headsets are not exclusive to gaming and entertainment.
They also serve distinct purposes in the healthcare industry, helpful in mastering highly-technical procedures such as transplants and the like.
