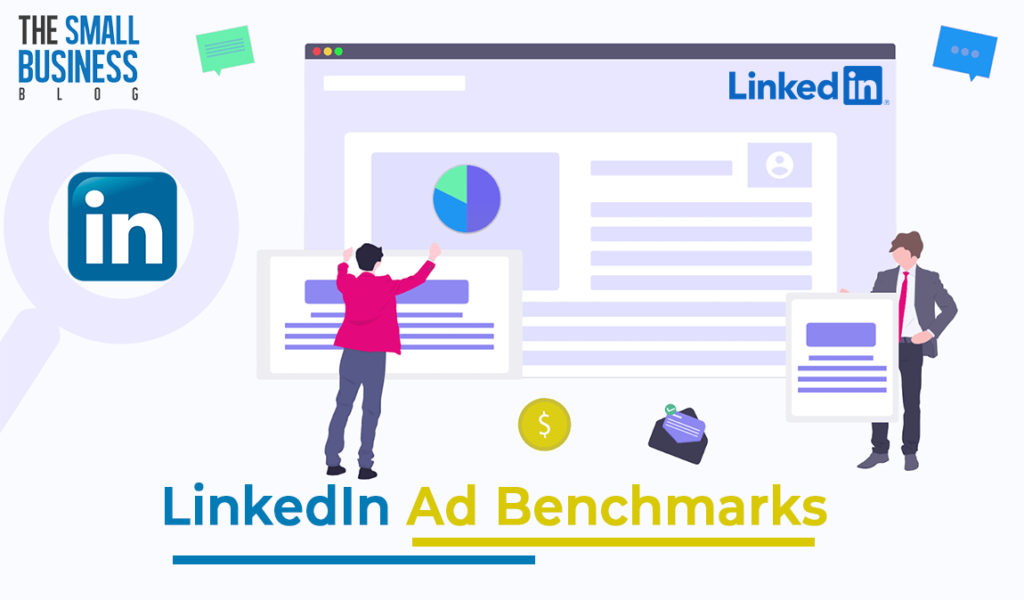
Looking for LinkedIn ad benchmarks for 2023?
The digital marketing landscape is changing every day.
While it is easy to look for the latest social media marketing trends, you might be looking for more detailed information.
Many people wonder if their marketing campaigns are performing well or what changes they should bring for improvement in 2023.
LinkedIn is a platform especially for professionals and businesses in the corporate world.
Unlike other social media platforms like Facebook and Instagram, LinkedIn creates a community for the professional industry to communicate with each other.
Many people turn to LinkedIn for B2B marketing campaigns, especially since their entire target market can be found on this platform.
If you are wondering how to stay on top of LinkedIn’s ad platform, then you need to know about the various types of ads on LinkedIn.
In this article, we’re covering everything you need to know about LinkedIn marketing and ad benchmarks for 2023.
Types of Ads on LinkedIn
Before you can dive into optimal LinkedIn ad benchmarks, you should review the ad types that you can use on the platform.
Remember that LinkedIn differs from other social media sites in various ways, which is why it is important to optimize your ad campaign to this specific platform.
Here are a few of the most popular types of ads on LinkedIn:
1. Sponsored Content
Sponsored content shows up in the audience’s newsfeed like any other content. They allow you to market your product or service effectively as the user scrolls through their feed.
In many cases, sponsored content is used to make users think that the ad just happened to appear on their feed organically.
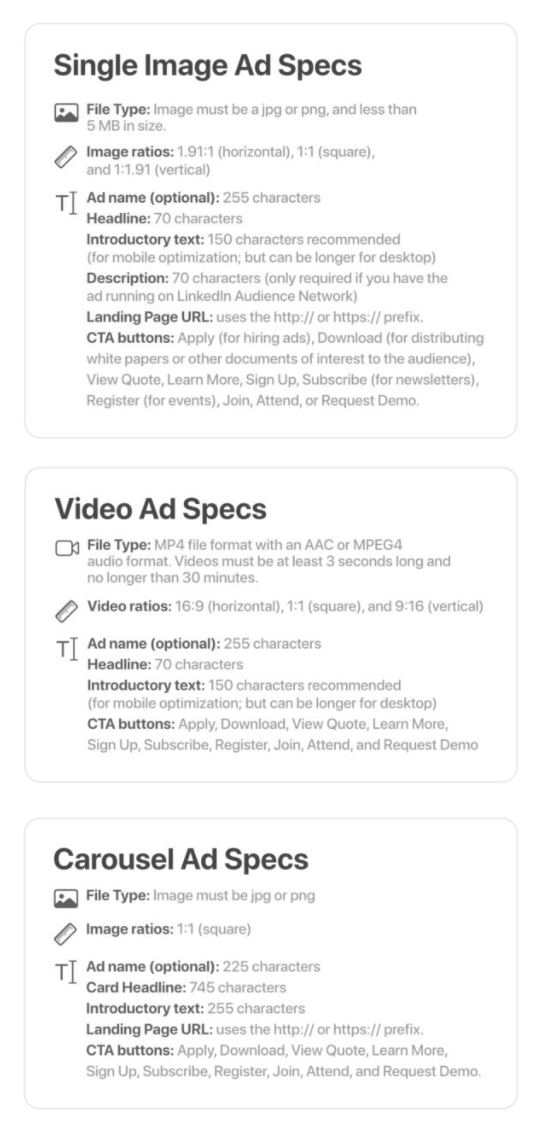
There are three types of sponsored content on LinkedIn:
- Single Image Ads
- Video Ads
- Carousel Ads (multiple images arranged in order)
Many marketers opt for sponsored content ads on LinkedIn to create brand awareness. If you are new to LinkedIn ads, then we recommend sticking to sponsored content initially.
This will help you generate leads and create top-of-funnel customer awareness.
2. Lead Gen Forms
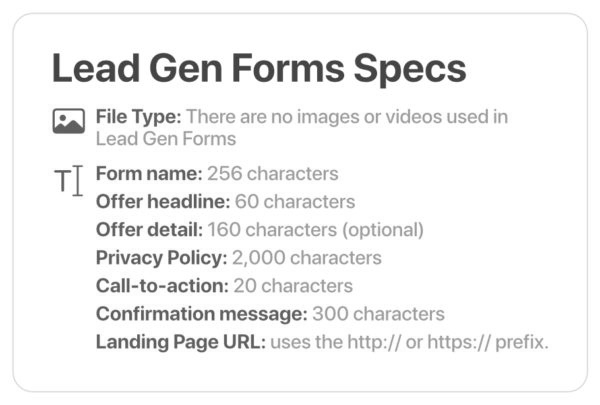
Once your business is accustomed to sponsored content ads, you can move on to Lead Gen Forms to generate more direct leads.
This type of LinkedIn ad is particularly useful in targeting an audience that is already familiar with your brand and product portfolio.
Lead Gen Forms provide exceptional user experience as LinkedIn automatically fills certain fields using information from the user’s profile.
Fields like name, profile URL, and email address will already be filled when your ad shows up on a user’s newsfeed.
Designing an effective Lead Gen Form is where most marketers lose customers. Remember to always keep the customer first, which means including as few fields as possible to make form-filling quick and easy.
LinkedIn has the following rules for Lead Gen Forms:
- Include a minimum of 3 fields
- The maximum number of fields is 12
- Can choose from Full name, Email address, Profile URL, Contact Number, Job title, City, and many more.
3. Text and Dynamic Ads
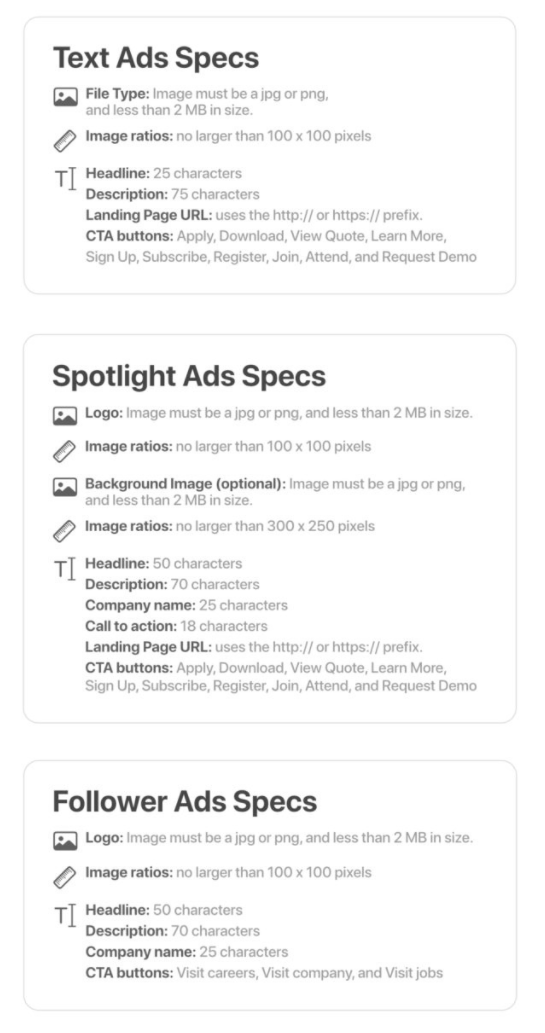
If you are already familiar with PPC ads, then Text and Dynamic Ads are no different. Text Ads are used when you only want to display text automatically as an ad on the newsfeed.
For customizations, you can use Dynamic Ads (also known as Spotlight Ads).
For either of these ads, you can set a PPC cap that controls whether you play for clicks or impressions on your page.
Using Text or Dynamic Ads on LinkedIn is especially useful for companies who want to attract more attention to their company page.
Unfortunately, it is not beneficial to use Text and Dynamic ads for bottom-of-the-funnel customers or conversion campaigns.
4. Sponsored Messaging
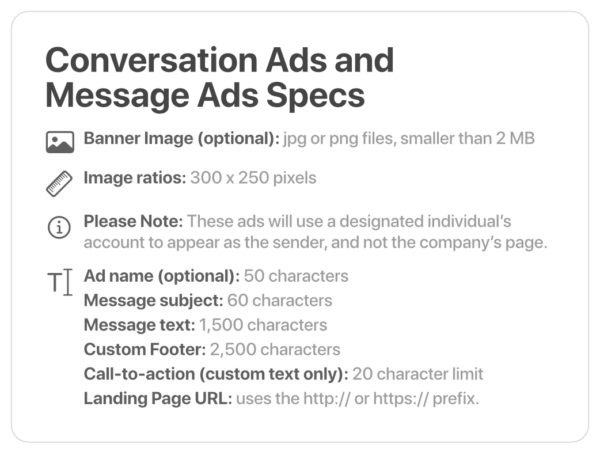
Connecting with your customers through Sponsored Messaging campaigns is a great way to initiate a conversation about your product or service.
There are two types of Sponsored Messaging on LinkedIn: Message Ads and Conversation Ads. Message Ads are the most similar to organic messages sent to the contacts you are connected with.
There are no call-to-action buttons, and the Message Ads are sent directly to the customers via LinkedIn’s chat feature.
Similarly, Conversation Ads do have call-to-action buttons and encourage the users to access more information about your company.
For example, they can click on a button in the chat to view your company page, product list, etc.
LinkedIn Ad Benchmarks
Knowing the different types of ads on LinkedIn is not enough. Even if you integrate each of these ads in your marketing campaign, there is no way of knowing that your efforts are successful.
To evaluate the performance of your ads and further optimize your campaigns, you need to look at a few LinkedIn ad benchmarks.
These metrics can show you how well your ads are performing as compared to other companies in a similar niche.
Some of the common benchmarks that are essential for Linkedin advertisers are given below:
- Click-through rate (CTR)
- Cost per click (CPC)
- Cost per impression (CPI)
- Cost per lead (CPL)
- Engagement rate
- Lead gen form completion rate
- Conversion rate
- Cost per conversion
- Linkedin message ads / Inmail benchmarks
You should keep in mind that not all of these benchmarks are equally important. It is important to focus on the ones that provide the most value to your advertisement objective and format.
That being said, these are a few LinkedIn ad benchmarks that you should consider for your marketing campaign.
Click-Through Rate (CTR) Benchmark
The Click-Through Rate (CTR) is specifically for the Sponsored Content ads on LinkedIn. Every time a user views your ad, they have an option to click on it and discover more about your brand.
However, not all clicks are equally chargeable. The CTR benchmark, therefore, only calculates the number of chargeable clicks divided by the number of impressions.
While CTR can vary based on countries and regions, the global average is fixed between 0.44% to 0.65%.
Developed nations have more saturated markets, which means they have a lower average CTR than developing nations.
There is also further variation in the CTR benchmark depending upon the type of Sponsored Content.
For a single image, the average CTR is 0.56%. However, for both video content and a carousel, the CTR is lower at 0.44% and 0.40% respectively.
There will also be a difference in your average CTR depending upon the job functions of users. The highest CTR is seen in the Business Development and Education niches at 0.65% each.
Human Resources has an average CTR of 0.62% and Accounting and Finance have a CTR benchmark of 0.60%.
Remember that these metrics are not definite values that should determine your LinkedIn marketing campaign.
Instead, you can use them as directional cues to evaluate whether your ads are performing well, depending upon the type and niche.
Having a low CTR means that your ads are not appealing enough to the audience. In that case, you might need to reevaluate your marketing strategy or test new audiences.
Cost Per Click (CPC) Benchmark
When you run a marketing campaign on LinkedIn, you need to be paying a service fee to the platform. The CPC benchmark refers to how much you’re paying per click.
This metric helps you identify whether the cost is justified for the number and type of clicks that you are getting – is your conversion rate high enough?
Unfortunately, the CPC is not in your control. LinkedIn determines the cost itself via an auction, and the rate is currently set at $5.58 worldwide.
There is a slight variation in the CPC depending upon seniority or job functions. For instance, senior decision-makers have a CPC benchmark of $6.40 whereas a junior employee’s benchmark is $4.40.
Similarly, the information technology niche has the highest CPC benchmark of $7.90. This is because most marketers on LinkedIn are targeting audiences from the IT niche.
Cost Per Impression (CPI) Benchmark
Apart from the CPC benchmark, you should also check your Cost Per Impression (CPI) to determine whether your total ad spending is justified.
CPI is calculated by dividing your total ad spend by the average total impressions. You can use the forecasting tool on LinkedIn to determine your average total impressions if you don’t have actual statistics.
Remember that the CPI is measured per 1,000 impressions. If your forecasted total impressions are 180,000, you should divide this number by 1,000 first to get 180. Then, you can divide your ad spend amount by 180 to get the CPI.
Now that you have your CPI, it is time to compare it with the benchmark. The average CPI on LinkedIn is about $34 per 1000 impressions.
However, it is not recommended to use this metric unless you are running extensive brand awareness campaigns on LinkedIn.
Cost per Lead (CPL) Benchmark
Impressions are not the only thing you should aim for as an advertiser. Instead, you need leads – impressions that are willing to convert into customers.
The Cost per Lead (CPL) refers to the amount of money that you are paying to get a lead. This metric is particularly useful for running lead generation campaigns, especially when searching for new customers.
However, there is no specific benchmark for the CPL. You cannot compare your CPL with other advertisers because you have a unique offer, creatives, and audience to cater to.
Statistics show that the average CPL on LinkedIn ranges between $15 and $350. Since this range does not seem too useful, you can refer to your historical data to create your own benchmark.
Conversion Rate Benchmark
The conversion rate is one of the most important aspects of your marketing campaign. No number of clicks and impressions is useful if you don’t have a good enough conversion rate on your site.
The conversion rate benchmark is the percentage of conversions over the number of clicks on your site. The LinkedIn benchmark varies between 5% to 15%.
However, this variance is caused by a difference in the way a company defines ‘conversion.’ For some, conversion means that a user clicked on a button on their site. For others, conversion might be a user filling out an entire lead gen form.
Depending upon what your definition of ‘conversion’ is, you can determine an average benchmark for yourself.
The easiest way to create a benchmark is to look at your historical data and consider the average amount of dollars you are spending per conversion.
The key to understanding the conversion rate benchmark is to consider how much a customer conversion is worth to your business.
Since LinkedIn typically houses B2B marketers, even one conversion can be worth more than a hundred low-quality leads.
Even if you are spending more on LinkedIn for conversions, remember that you are also earning a higher amount due to selling a high-value good or service.
Engagement Rate Benchmark
If you are wondering whether your ad campaign is reaching your audience, you can rely on this simple engagement rate benchmark.
This statistic measures how many times people engage with your ad, including both paid and free clicks.
The engagement rate benchmark for single image ads and carousel ads is 0.5%. Video ads have a higher engagement rate benchmark of 1.6% since videos tend to attract more user attention than basic sponsored content.
You can calculate your own engagement rate by dividing the total number of clicks by the total impressions on your ad. This way, you can determine how useful your marketing campaign has been in terms of user engagement.
If you have an engagement rate below the benchmark, then it is time to change your marketing campaign to make it more appealing to the audience.
Final Thoughts
Which LinkedIn ad benchmark is the best? How to measure marketing success with LinkedIn?
If you were previously asking yourself these questions, we hope you have all the answers now.
This knowledge about LinkedIn ads benchmarks can help you alter your marketing strategy to perfection.
While advertising on LinkedIn sounds a little more complicated than other social media sites, the lead generation and conversion rates are also much higher.
When you advertise a B2B product/service on LinkedIn, you can reach your target audience easily and generate high-quality leads.
You can use these ad benchmarks as a guideline to determine whether your campaign is performing well.
Remember that there is no better benchmark than your historical data. Every ad you launch on LinkedIn should have improved metrics than the previous one.
